Online Data Table
Together with the map area of the SCOUT-Studio program, the online data module is a powerful tool for monitoring vehicles and sensor readings in real-time.

Figure 1 - Online data table
By default, the online data module is located at the bottom of the screen, occupying the entire free area in width. However, like everything in SCOUT Studio, the module easily changes its location and can be attached to any border of the window.
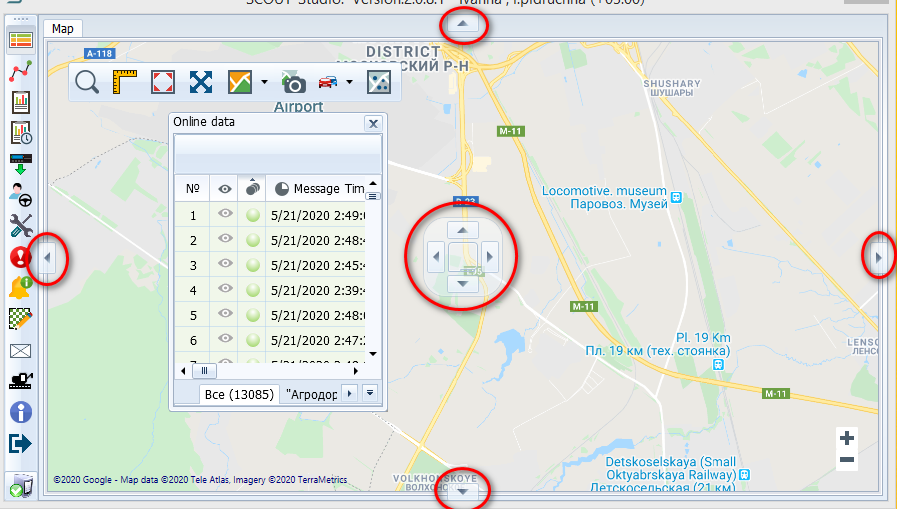
Figure 2- Change module location
In case the current data module interferes with the map view, you can hide it by clicking on the corresponding button in the toolbar (Figure 3):

Figure 3 - Button to hide the module of the current data
Clicking the button again displays the module in SCOUT Studio.
The online data module is divided into two parts.
At the top are tools for managing the displayed data and building tracks.

Figure 4 - Upper part of the online data module
In the lower part is a table of current data, which, as well, displays information about the condition of vehicles.

Figure 5 - Online data table
Vehicles can be split in groups, and the same vehicle can be in several groups at the same time. Groups are displayed as tabs at the bottom of the current data module.
Next, we will examine in more detail those tools that affect the behaviour of objects on the map.
To build a track, select a vehicle in the table, then set the time period and press the icon Build (Figure 6). Only one vehicle can be selected in the table at a time. You can build tracks on several objects - they are added to the queue in the module for managing tracks and managed from there. You can find out more about the track control module in chapter Tracks and the track control module.

Figure 6 - Toolbar for the track building module.
Find object field allows you to filter vehicles that match the entered data in the table of objects (Figure 7). The search is carried out in the fields Object name, State number, Description, Address. Objects that do not fall under the filter are hidden from the current data table.

Figure 7 - Search field
One of the most important tasks of the SCOUT Studio program is real-time tracking of vehicles. Combined with the map, the Online Data Table provides an excellent tool for this task (Figure 8).

Figure 8 - Online data table
The table of current data can be flexibly adjusted to the needs of the dispatcher, and it displays information about the status of the vehicle (connected, lagging or disconnected), the name of the monitoring object, state number, speed, date and time of the last received messages from the object, the number of satellites received, type of power, address, time of the message, tracking and description.
Message time - the time of the most recent message from the terminal,
GLONASS / GPS time - the time the last message containing data with GPS coordinates.
Location - the address of the vehicle, determined by the address bases located in the SCOUT Platform software. Geozone name in column Location of the current data is not displayed.
For users with the Administrator account, automatic updating of current data is disabled by default. Updating data is possible by pressing the Update data button (Figure 9) control in the upper left corner of the online data table.

Figure 9 - Location of the Update Data control element
For users with the Dispatcher account, autoupdate works if:
- there are less than 1000 terminals in the current tab, then auto-updating of current data occurs every 10 seconds.
- there are more than 1000 terminals in the current tab, the current data is updated by activating the Load current data control element (Figure 9).
Columns can be set in any custom order (you can drag to the desired location, or in the settings of the table of current data set a sequence). Controlled parameters are usually displayed as a text value, but some of them, for simplification of perception, can display the value in the form of pictograms.
In addition to the parameters listed above, it is possible to display the values of logical sensors. You can learn more about what a logical sensor is in the chapter Logic Sensor Settings. For example, column Fuel can be added, in which the current (level) volume of fuel in the fuel system will be displayed. The value is displayed with an accuracy of 1 digit after the decimal point, which can be seen in Figure 3.
When selecting a vehicle, it becomes possible to build its track. Double-clicking on a line makes the map focus on this car, that is, the map is shifted so that the car is centred on the screen.
The context menu (displayed by clicking the right mouse button) for the vehicle allows you to build a track in one click for the current day, enable tracking mode, leave comments and configure the vehicle (Figure 10).

Figure 10 - The context menu for the vehicle
In tracking mode when the vehicle is moving, it always remains in the centre of the map, shifting when the map is moving. This is convenient if you are monitoring a selected object.
Notes on objects allow you to leave text entries for the selected vehicle. At the same time, the recording time and login of the employee who left the note are recorded.
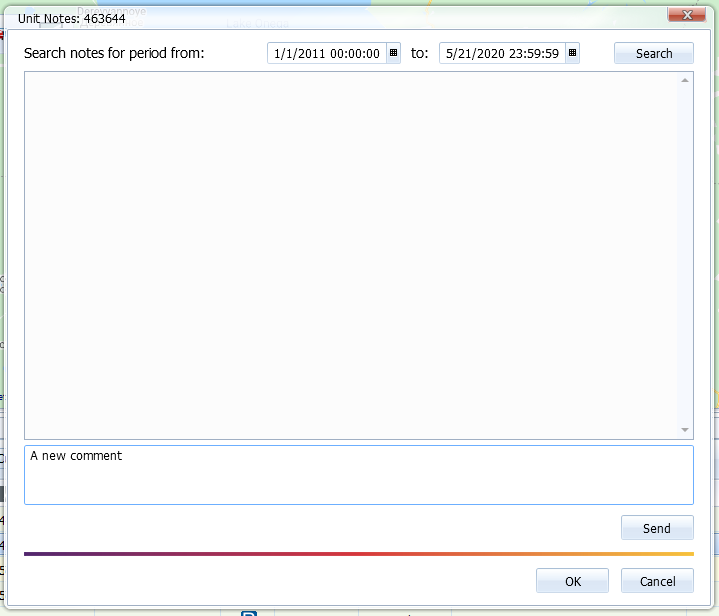
Figure 11 - Window with notes on a vehicle
In addition, you can also quickly go to vehicle settings from the context menu by choosing Open settings.
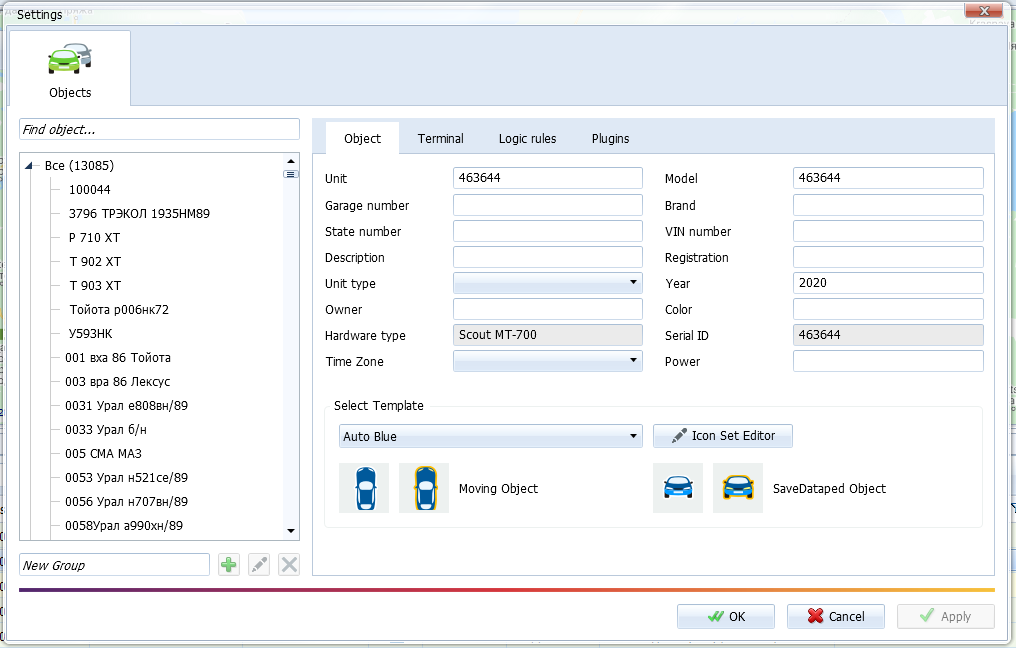
Figure 12 - Vehicle settings window.
Online Data Settings icon allows you to configure the table.
![]()
Figure 13 - Settings icon
On the Options tab, you can adjust the colour highlighting of lines associated with the operation of the object. By default, data with a delay of less than 10 minutes is considered online, in the interval from 10 to 60 minutes - lagging. If the delay is more than 60 minutes, then it is considered that the vehicle has lost signal. Here you can set what period of time is considered a lag. It is important to remember that you cannot set a value less than the lag value than online.
The parameter Use line highlighting allows highlighting lines in the current data according to these rules.
Parameter Brightness sets the intensity of lines highlighting.
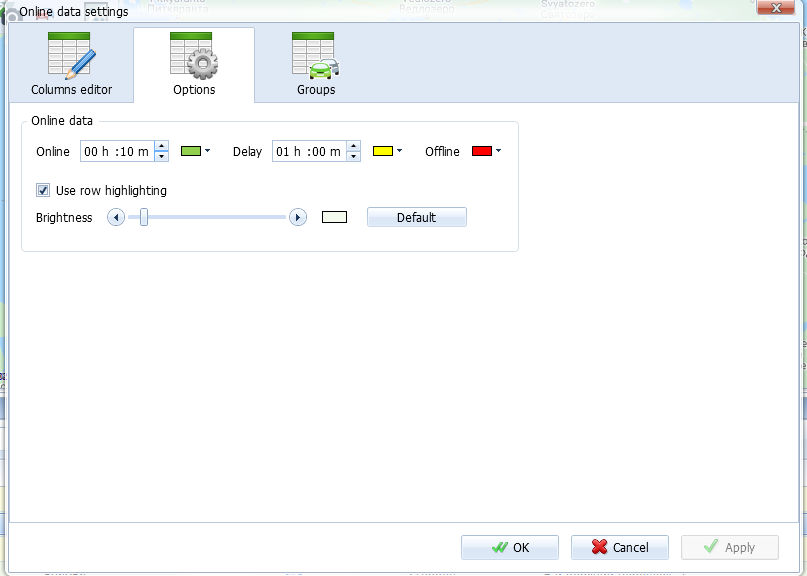
Figure 14 - Column setup options
In the tab of Column Editor, you can configure the data that will be displayed in the current data table, as well as the names of the column headings of this table.
When setting up at the very beginning, you need to select a group to make changes in it (since for each group the settings are individual). Then create a new profile. The previously created profile can be applied to any group. If the difference between the existing and the created profile is small, then it is possible to clone the existing profile and make the required changes to the clone. Changes are made by moving the parameter names from Available columns to Selected columns. Here you can adjust the order of the columns, their name, width and how the data and names will be displayed - an icon or text.
Two sets of templates are preinstalled in the field Profile: Manager and Diagnostics. They have different columns in the table.
It is also possible to display the values of logical sensors in the table of current data. To do this, first, add the required sensor to the list of available columns (left list), and then transfer it to the list of selected columns (right list).
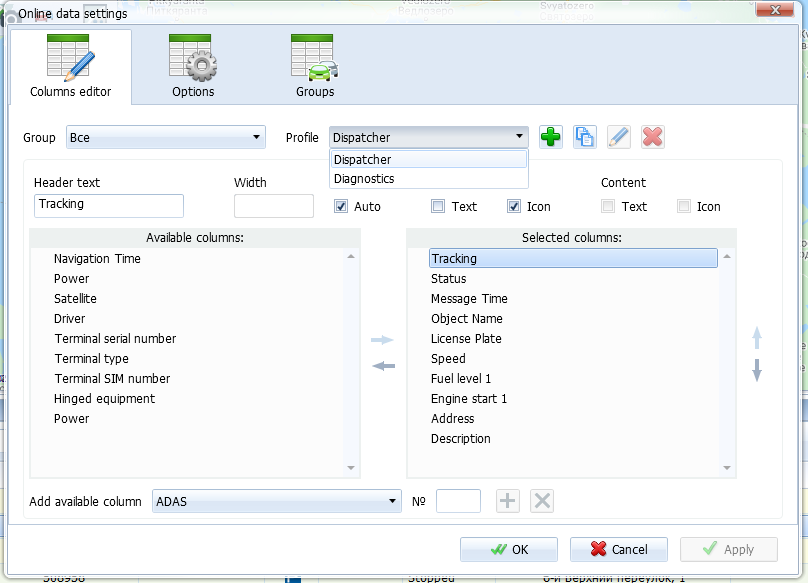
Figure 15 - Column editor
If you need to remove the sensor from the selected ones, you need to transfer it back to the available ones. You can also remove the sensor from there by pressing the key Delete.
Logical sensors are numbered from the first. Even if the logical sensor is the only one, it is always numbered, and this number must be indicated in the settings for displaying the current data table (for example, 1).
The name of the object displayed in the current data table does not have to be the state number. You can learn how to rename an object from the chapter Configuring the object .
Article Number: 3454
Author: Thu, May 7, 2020
Last Updated: Fri, May 22, 2020
Author: Анисимов Максим Михайлович [m.anisimov@scout-gps.ru]
Online URL: https://kb.scout-gps.ru/article/online-data-table-3454.html